STUDENT
- Home /
- STUDENT
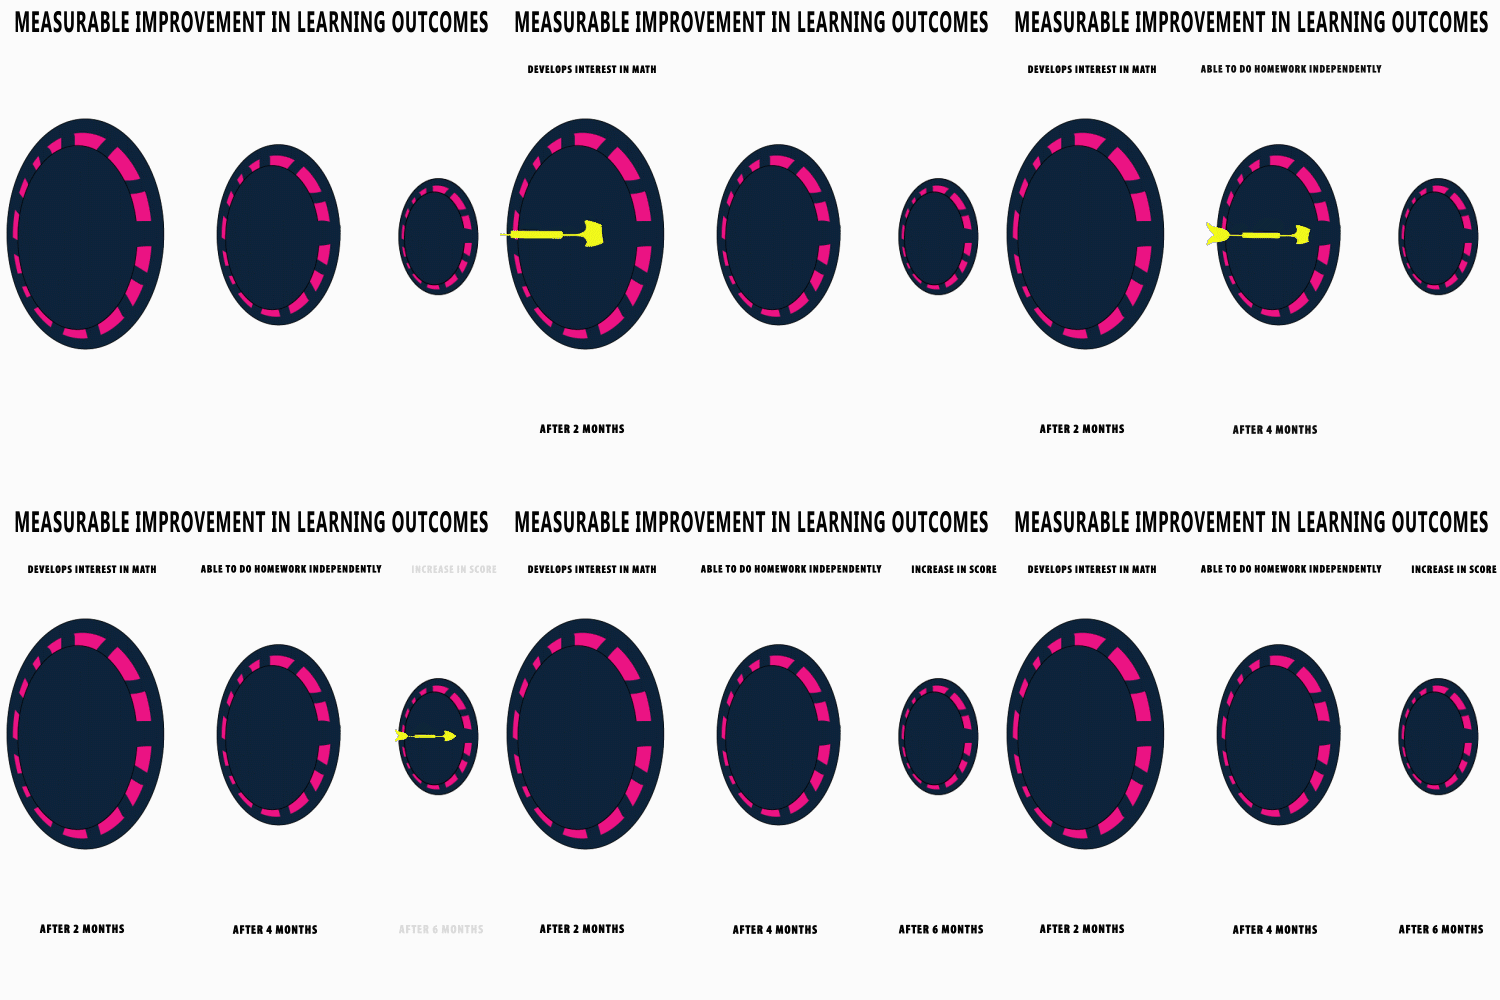
Changes that can be observed in more than 80 % student where Vikalp Experiential Learning is being practiced.
- After two month of implementation students starts developing interest in mathematics. Fear of mathematical concepts takes a back seat. They are able to relate maths to real life and make it meaningful.
- Once students start liking they also start doing homework on their own. It is observed that after four months most of the students are able to do homework independently.
- Its only after six months conceptual understanding of students increases and there is a visible change in the Math’s score of 80% of the students.

THIRD PARTY ASSESSMENT SURVEY
RESULT OF IMPACT ASSESSMENT BY FSG
Evaluation Agency
FSG has conducted this study to assess the impact. They have developed the Scoring Tool for Assessing Readiness at School (STARS). Shortlisted and trained assessors from Modulus Research and Analysis who were shortlisted for this study
Size of evaluation
134 Affordable Private Schools (APS) that included
- Treatment group of 106 APS where intervention is on
- Control group of 28 APSs where there is no intervention
Methodology
Assesses schools across 5 key sections namely classroom environment, learning outcomes and interviews with administrators, teachers and parents.
Key findings
Vikalp schools scored 61% higher than control schools on Sr. KG student math learning outcomes.
RESULT OF IMPACT ASSESSMENT BY GREY MATTERS
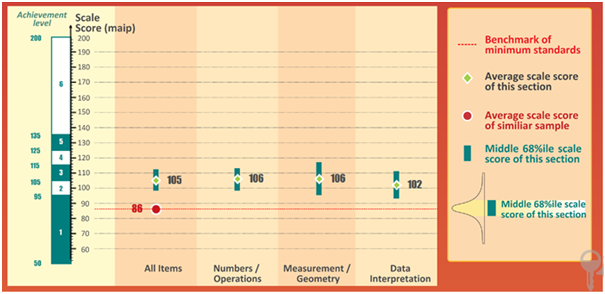
The students of this class were assessed by Gray Matters in Mathematics to find student’s performance and is reported in the Indian Progressive Achievement Scales (IPAS). The test papers used for the assessment are developed by Australian Council for Educational Research (ACER), an internationally renowned educational research body.
The graph below shows the performance of sample in the test across the three strands. The table is based on overall performance of sections where Vikalp methodology was implemented versus performance of sections where conventional teaching was practised.
Average scale score of sample where conventional teaching is practised – 88 out of 200
Average scale score after 1 year of implementation of Vikalp methodology – 105 out of 200
RESULT OF LEAN DATA SURVEY BY ACUMEN
Evaluation Agency
Lean data study by Acumen
Size of evaluation
2500 parents of students studying between Grade 1 to 5 in 26 partner schools
Methodology
Telephonic interview of parents
Key findings
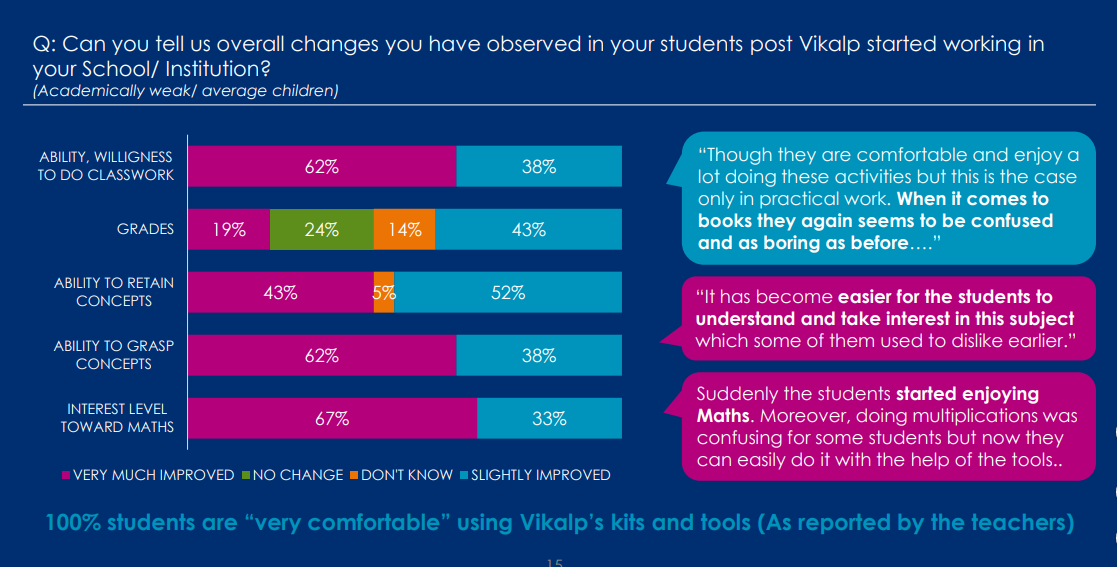
80 % parents observed increase in their child’s score
83% parent observed improvement in quality of life (interest in maths, ability to grasp concepts, willingness to do homework independently)


